WGSN Stream — Concept Development
Find the dynamic format and presentation that will drive engagement and reflect WGSN's position as a design leader within the design industry we serve.
Role
Design direction
Design
Overview
In H1 2023, WGSN set out to make trend content faster to get through without losing its depth. Dynamic Cards was the design concept I led in response.
The Challenge
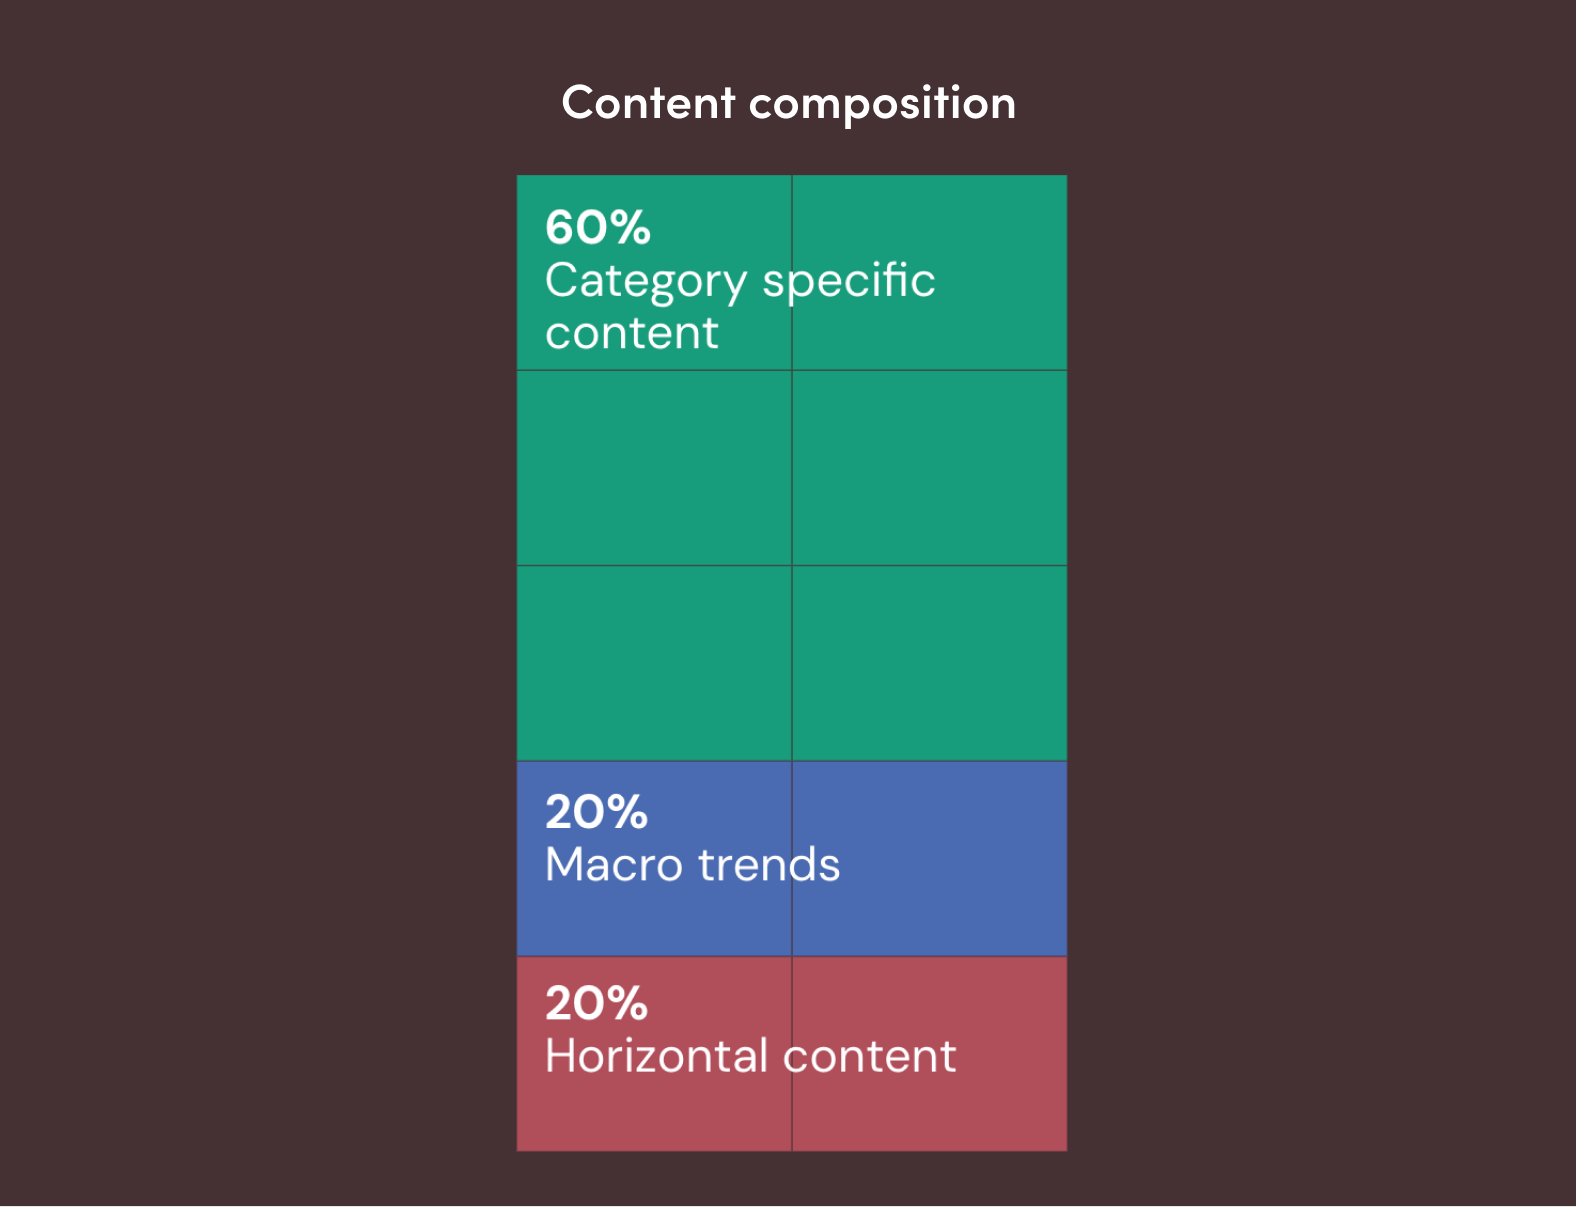
NPS feedback kept surfacing the same request: reduce lengthy articles to nuggets of trend information by category, with a path to full detail when it's wanted.
Approach
Breaking Trend Content into Atoms
Blue sky thinking, mobile first, buyers as the initial audience.
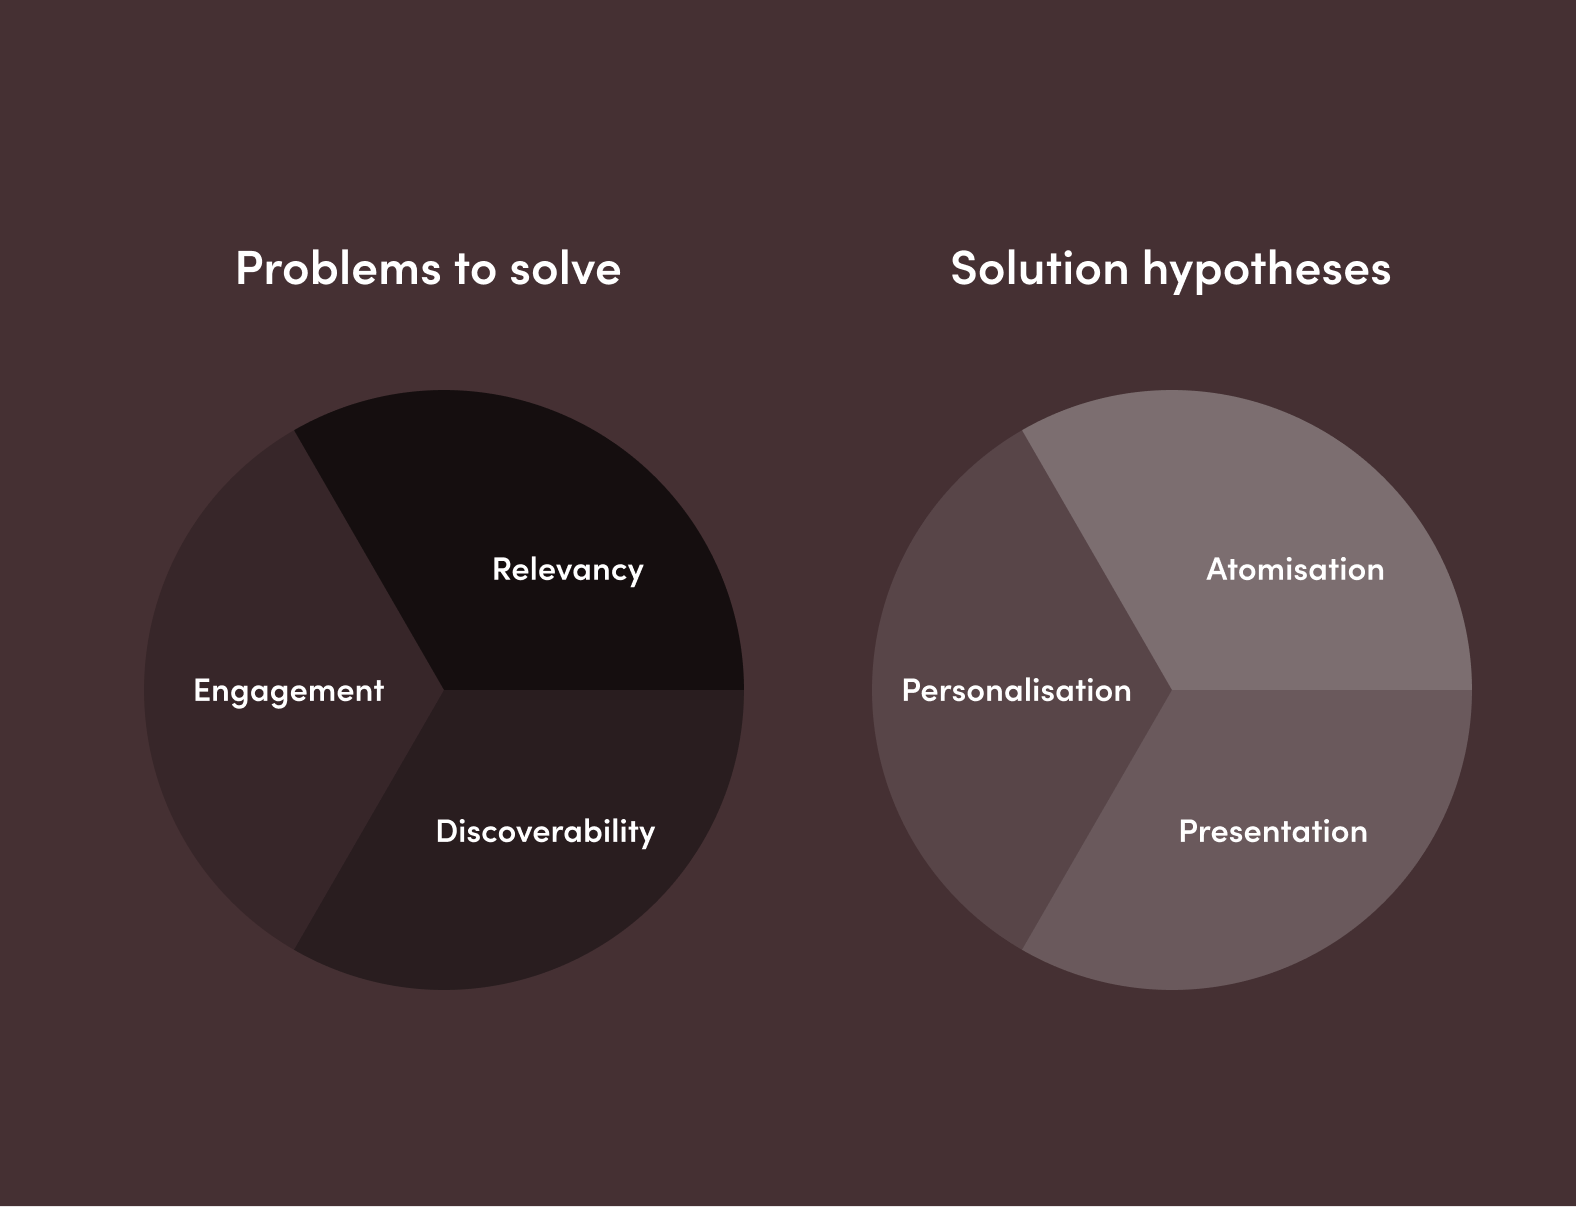
Three hypotheses: atomisation (smaller content units), personalisation (surfacing what's relevant), and presentation (the right format).
Building Dynamic Cards
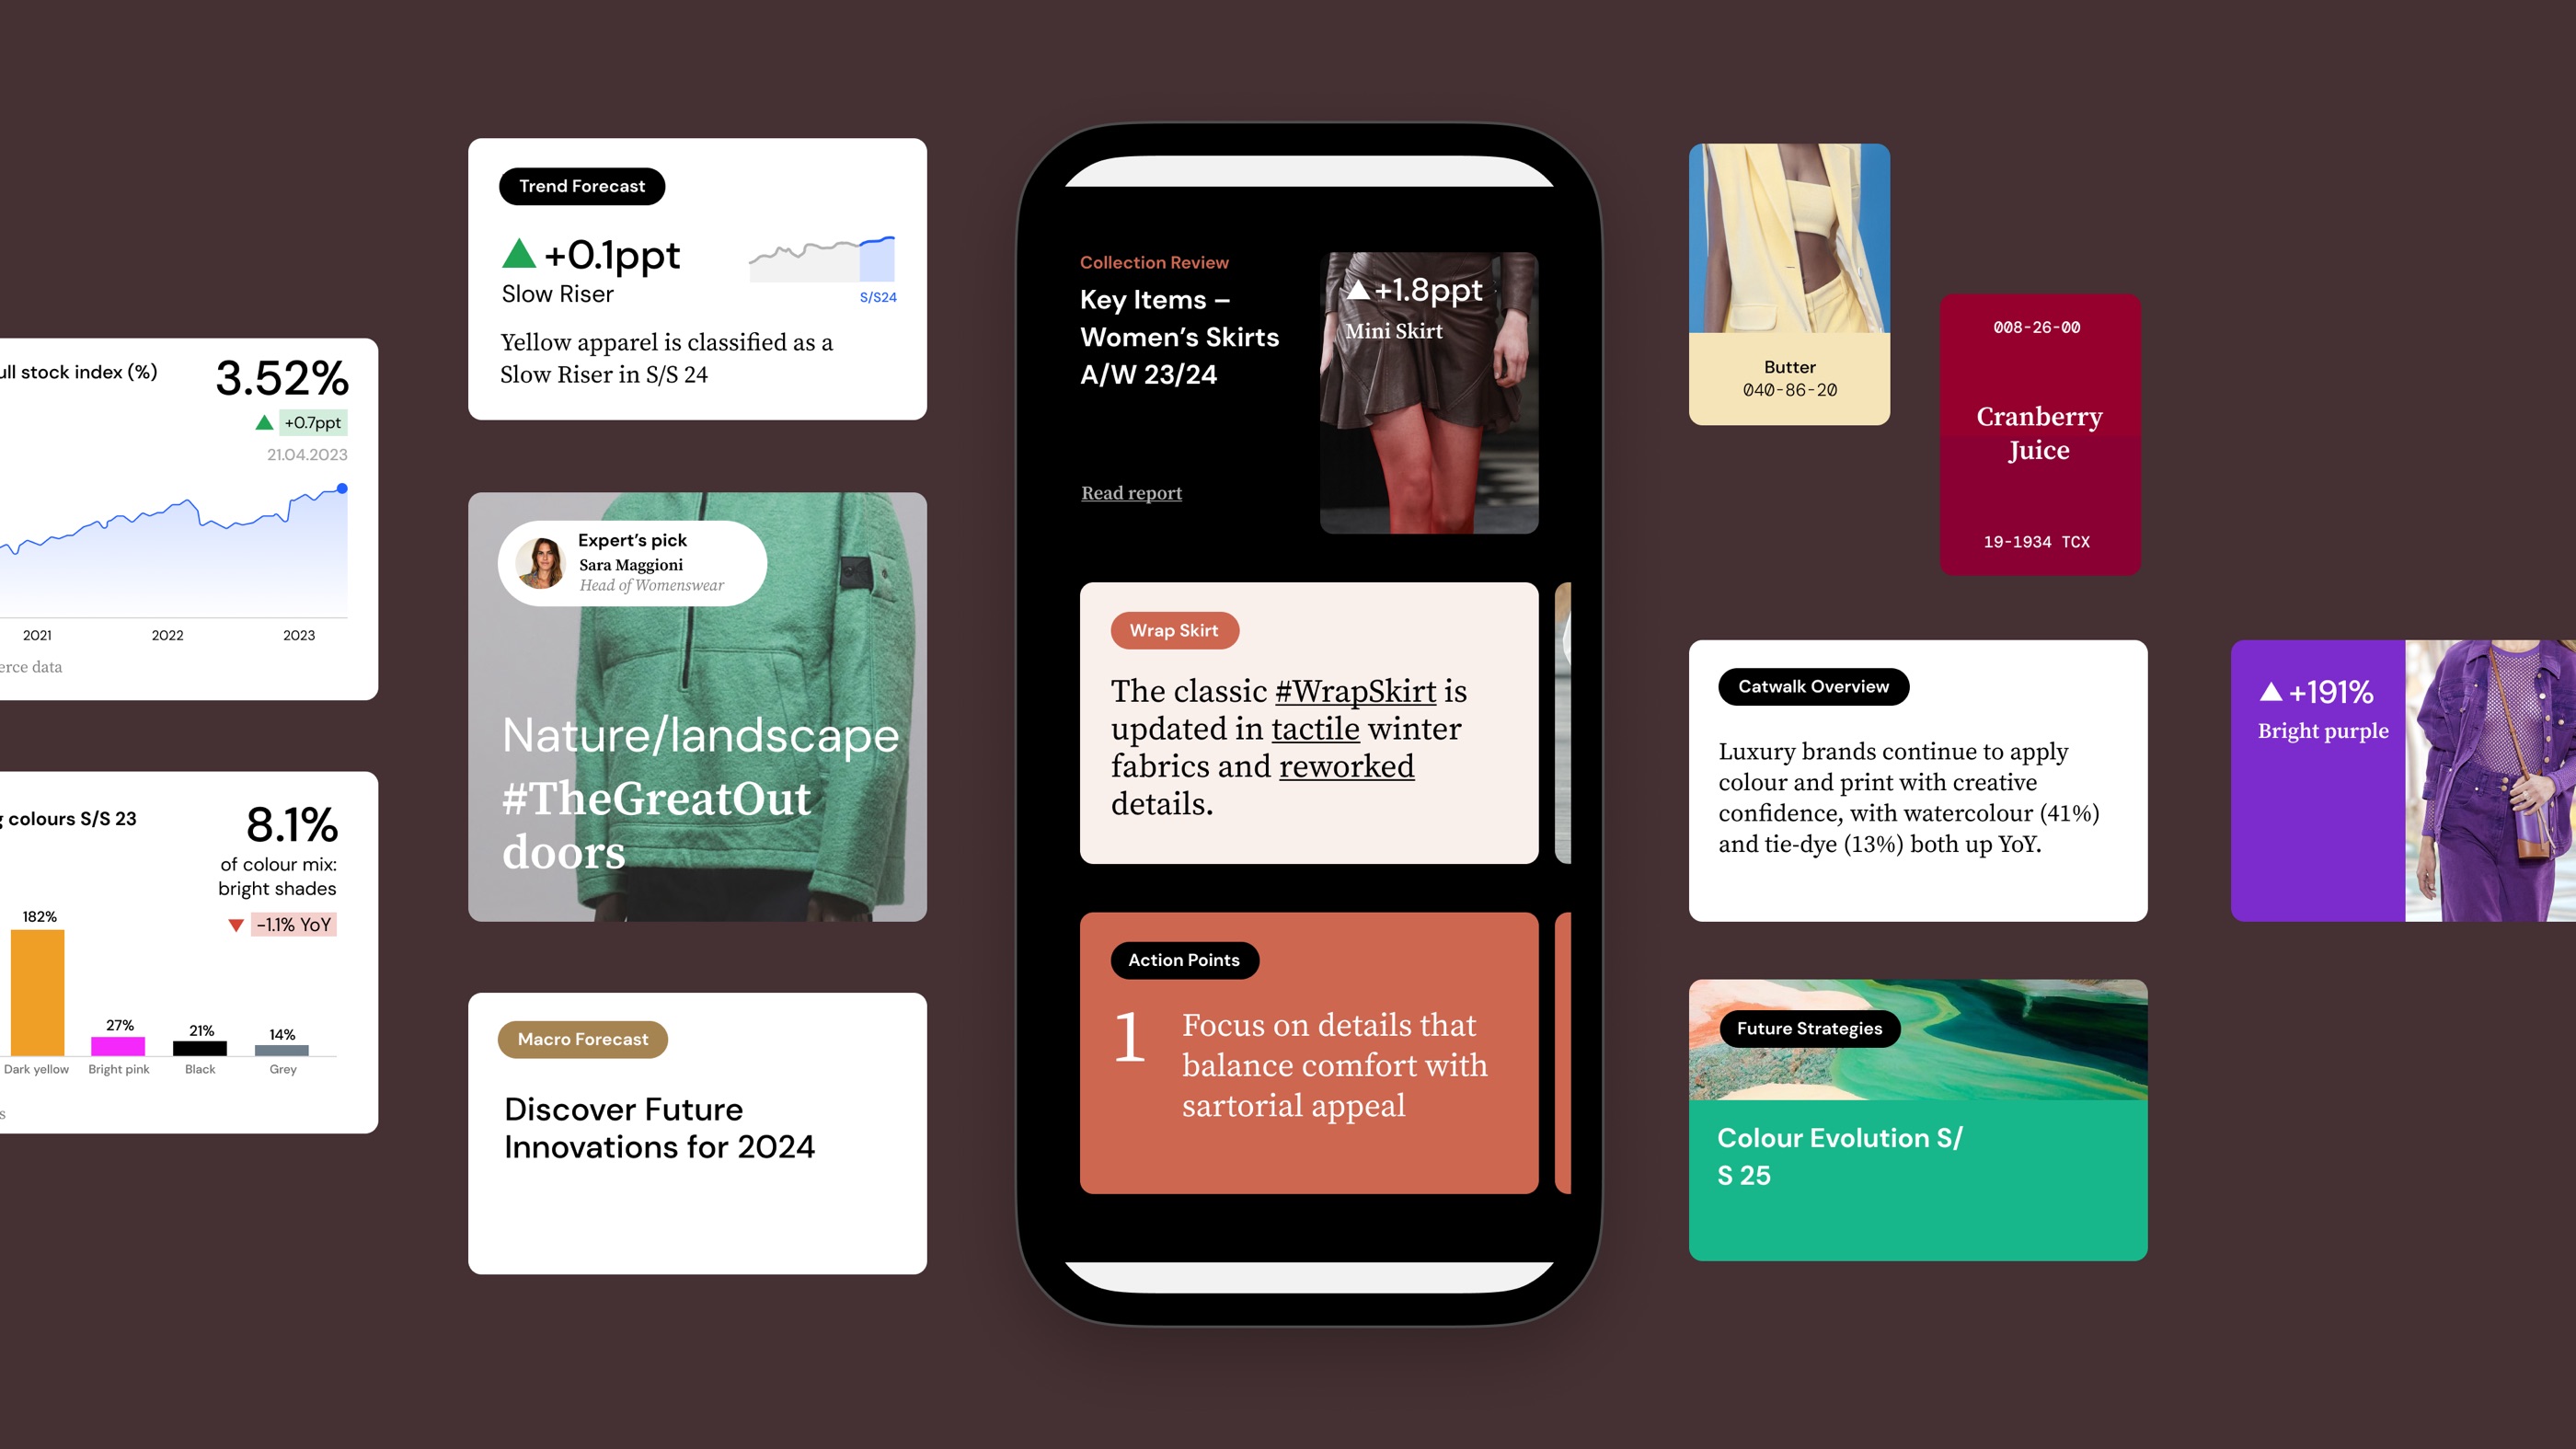
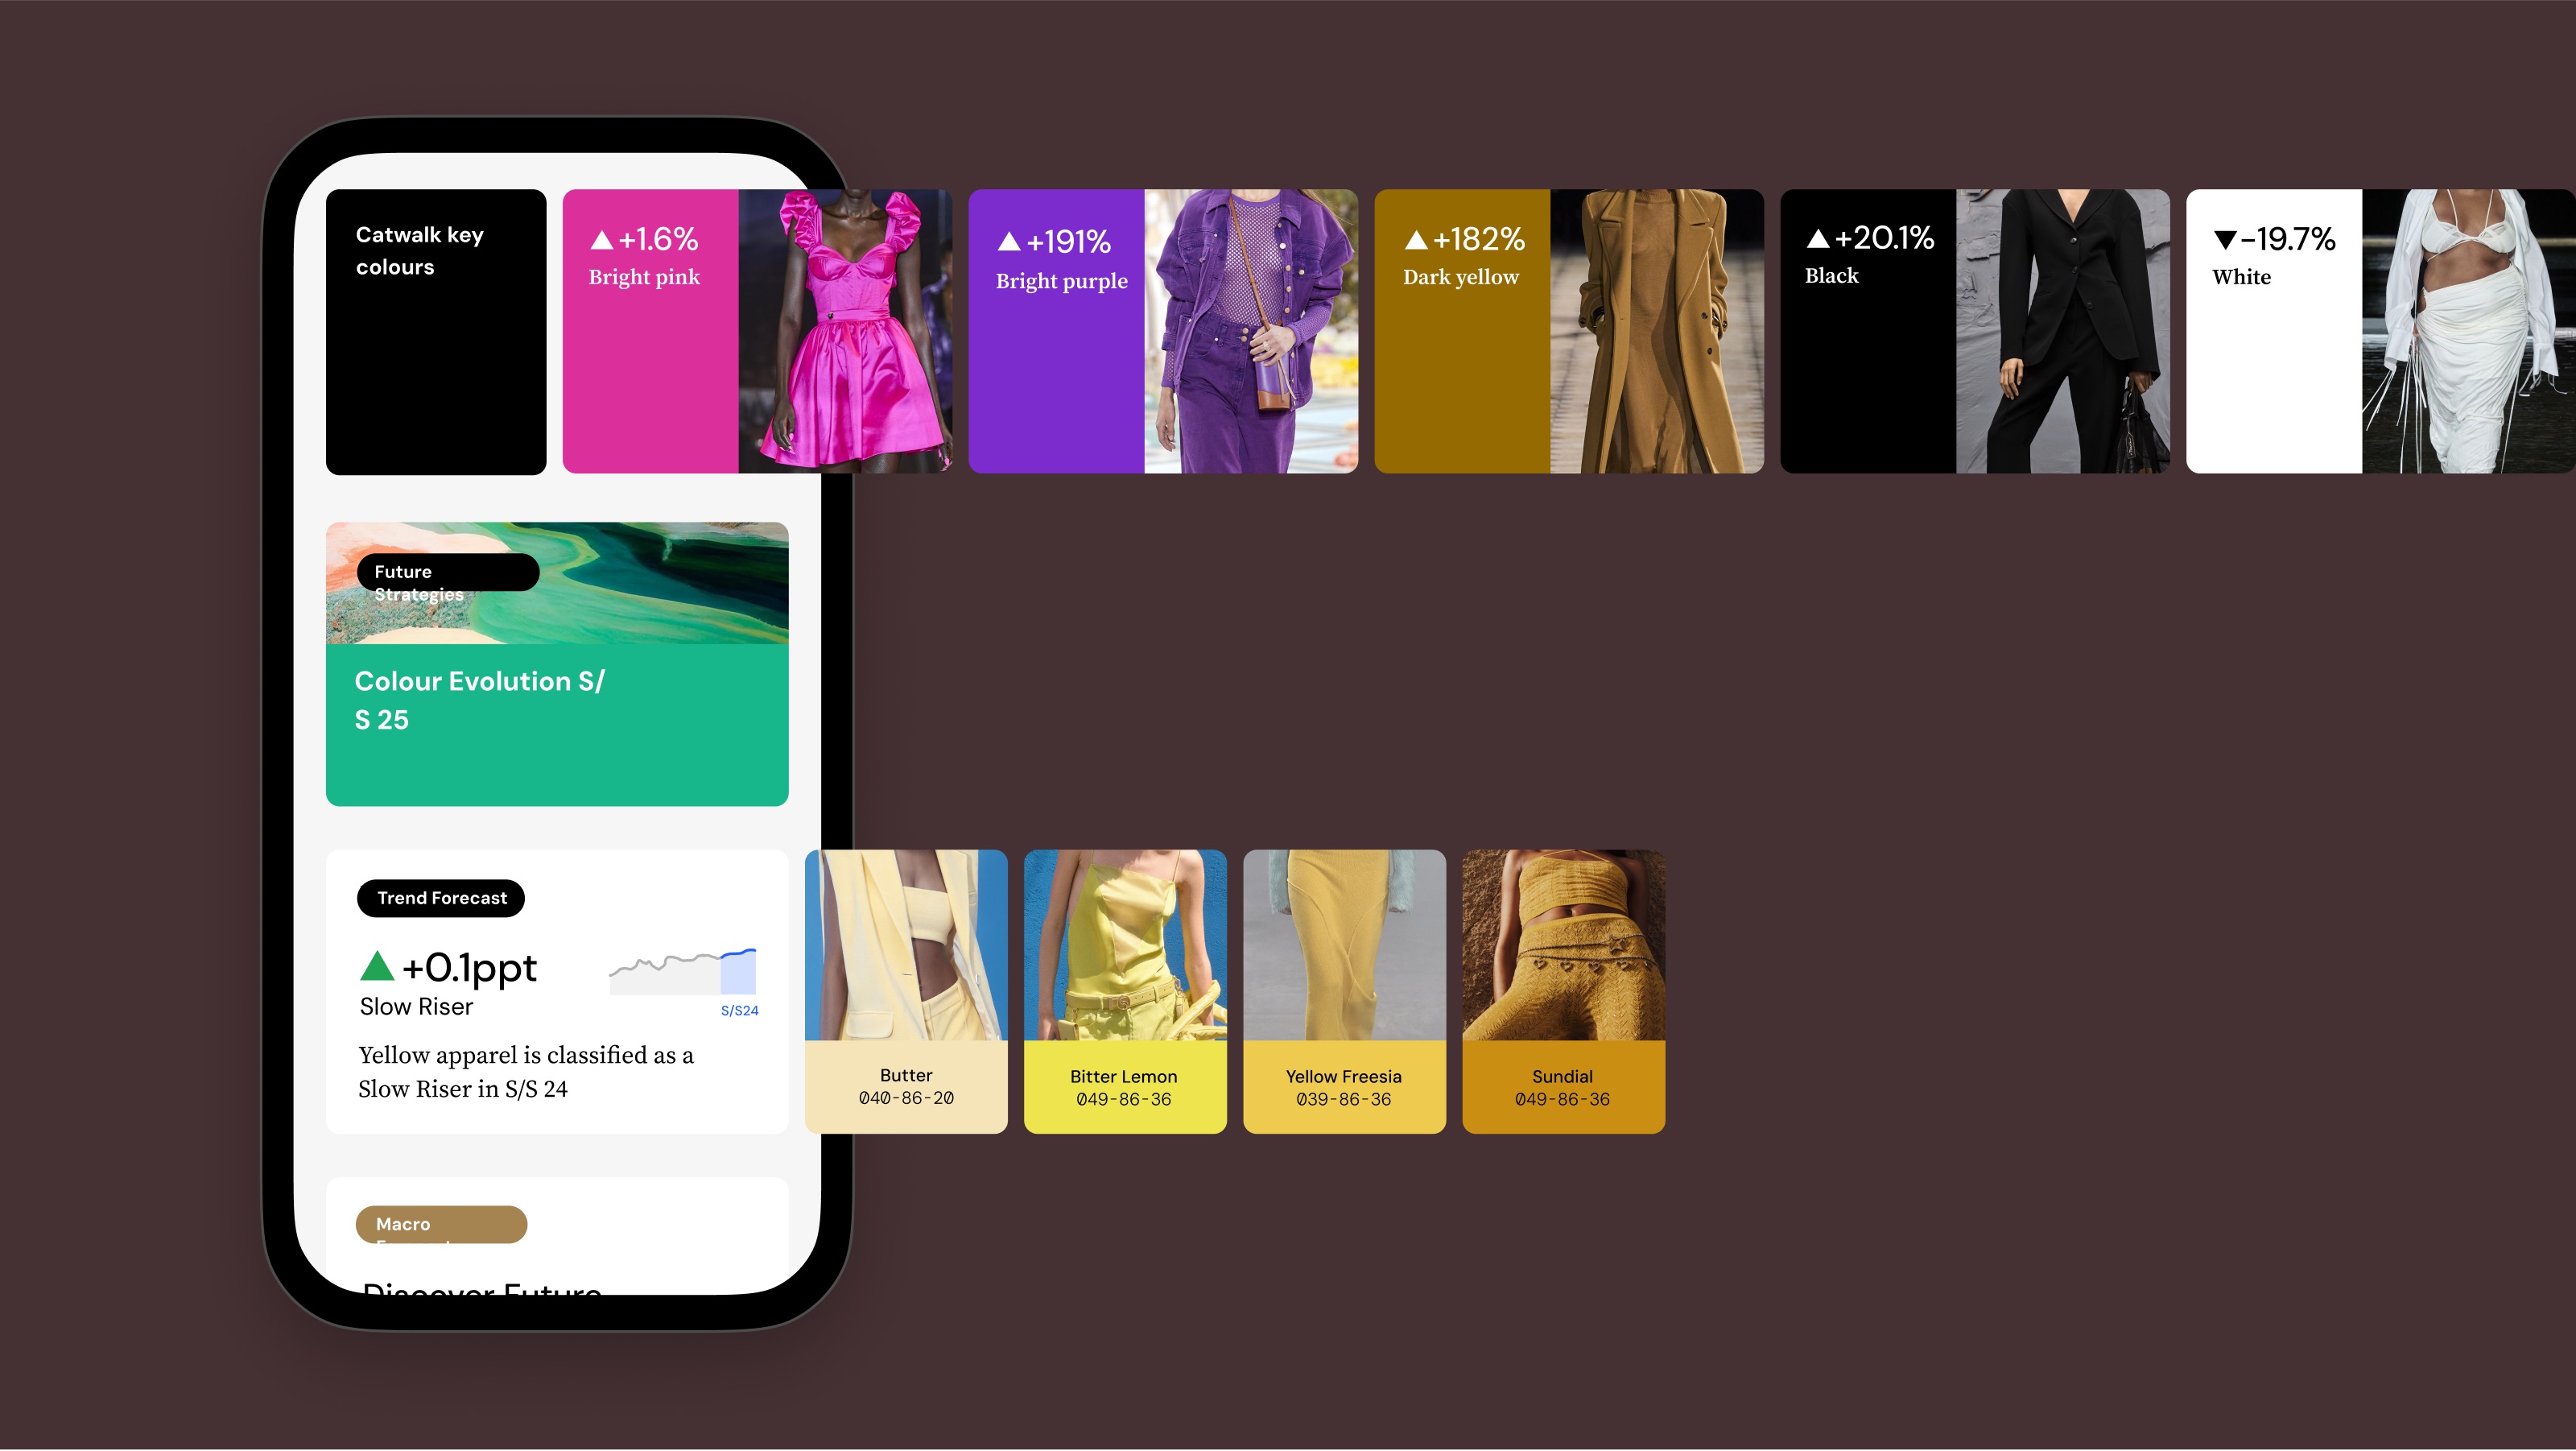
A personalised stream that dynamically aggregates content by relevance and recency.
Fluid. Lightweight. Instant. Conversational. Utilitarian.
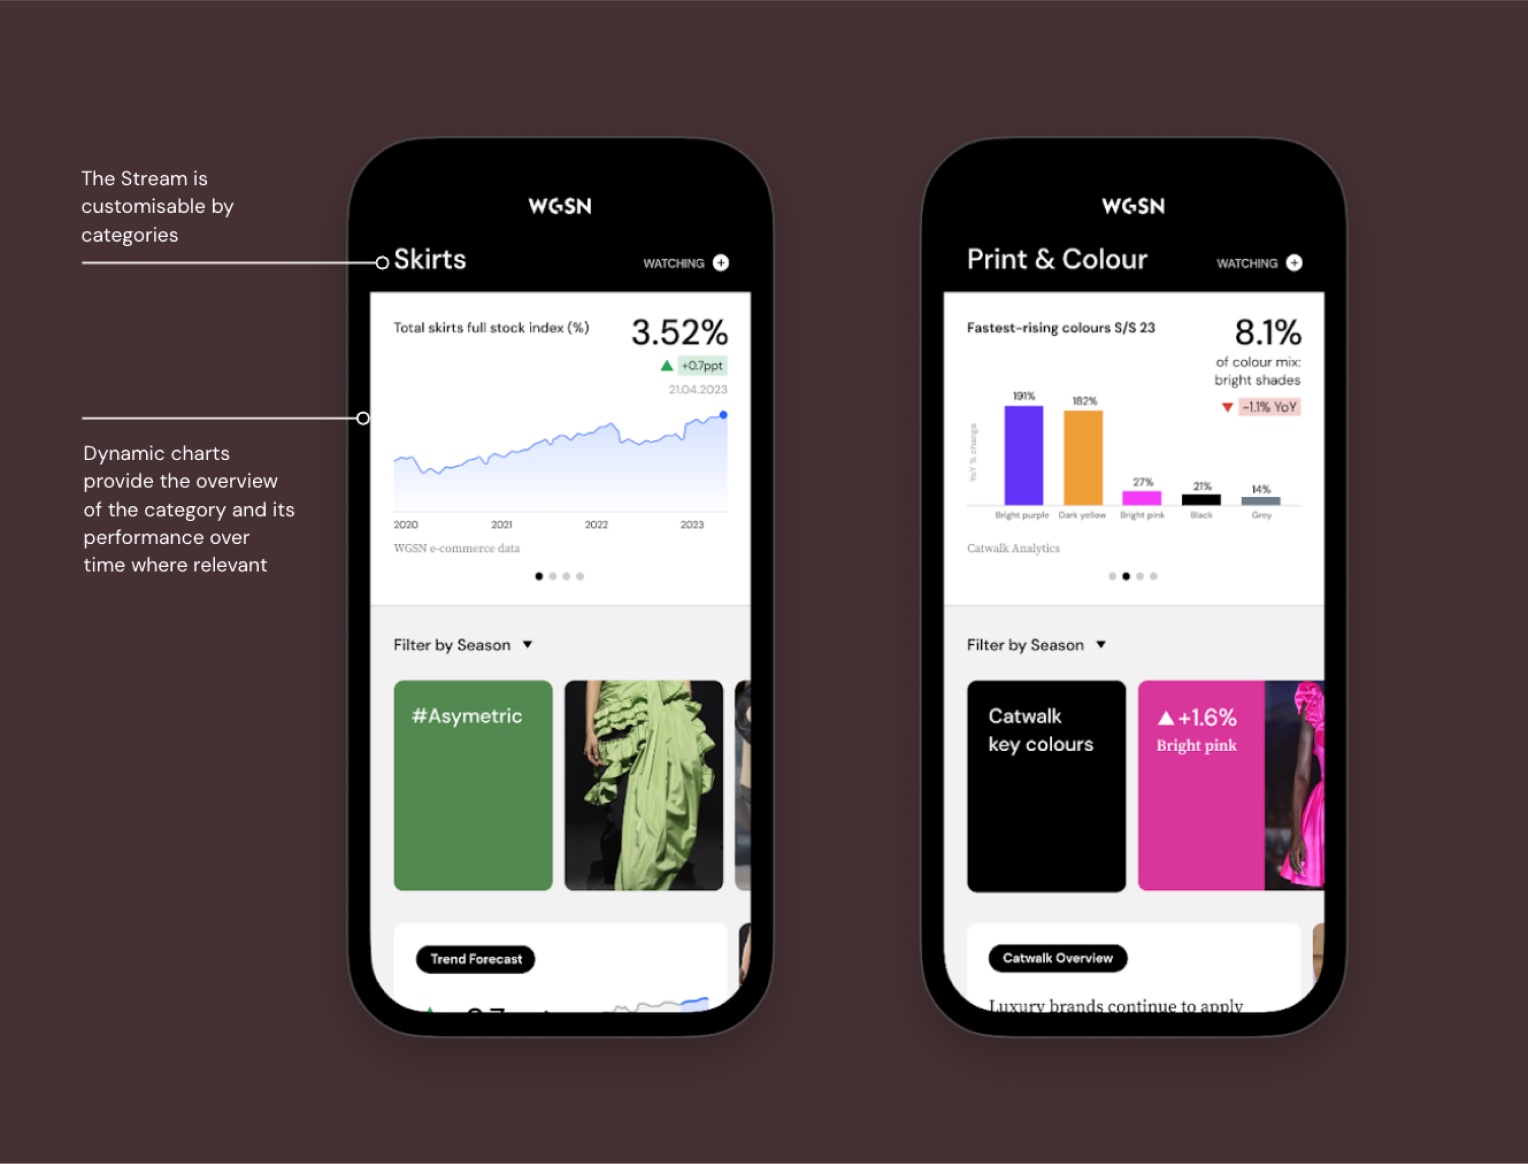
Customisable by category. Each category is led by a data card showing its performance over time.
Micro and macro cards. A card can be an image, a hashtag, a data callout, or a full report, pulled in by relevance and recency. Related cards group into a collection.
Swipe to explore. Supporting content sits alongside its parent card, reached with a swipe.
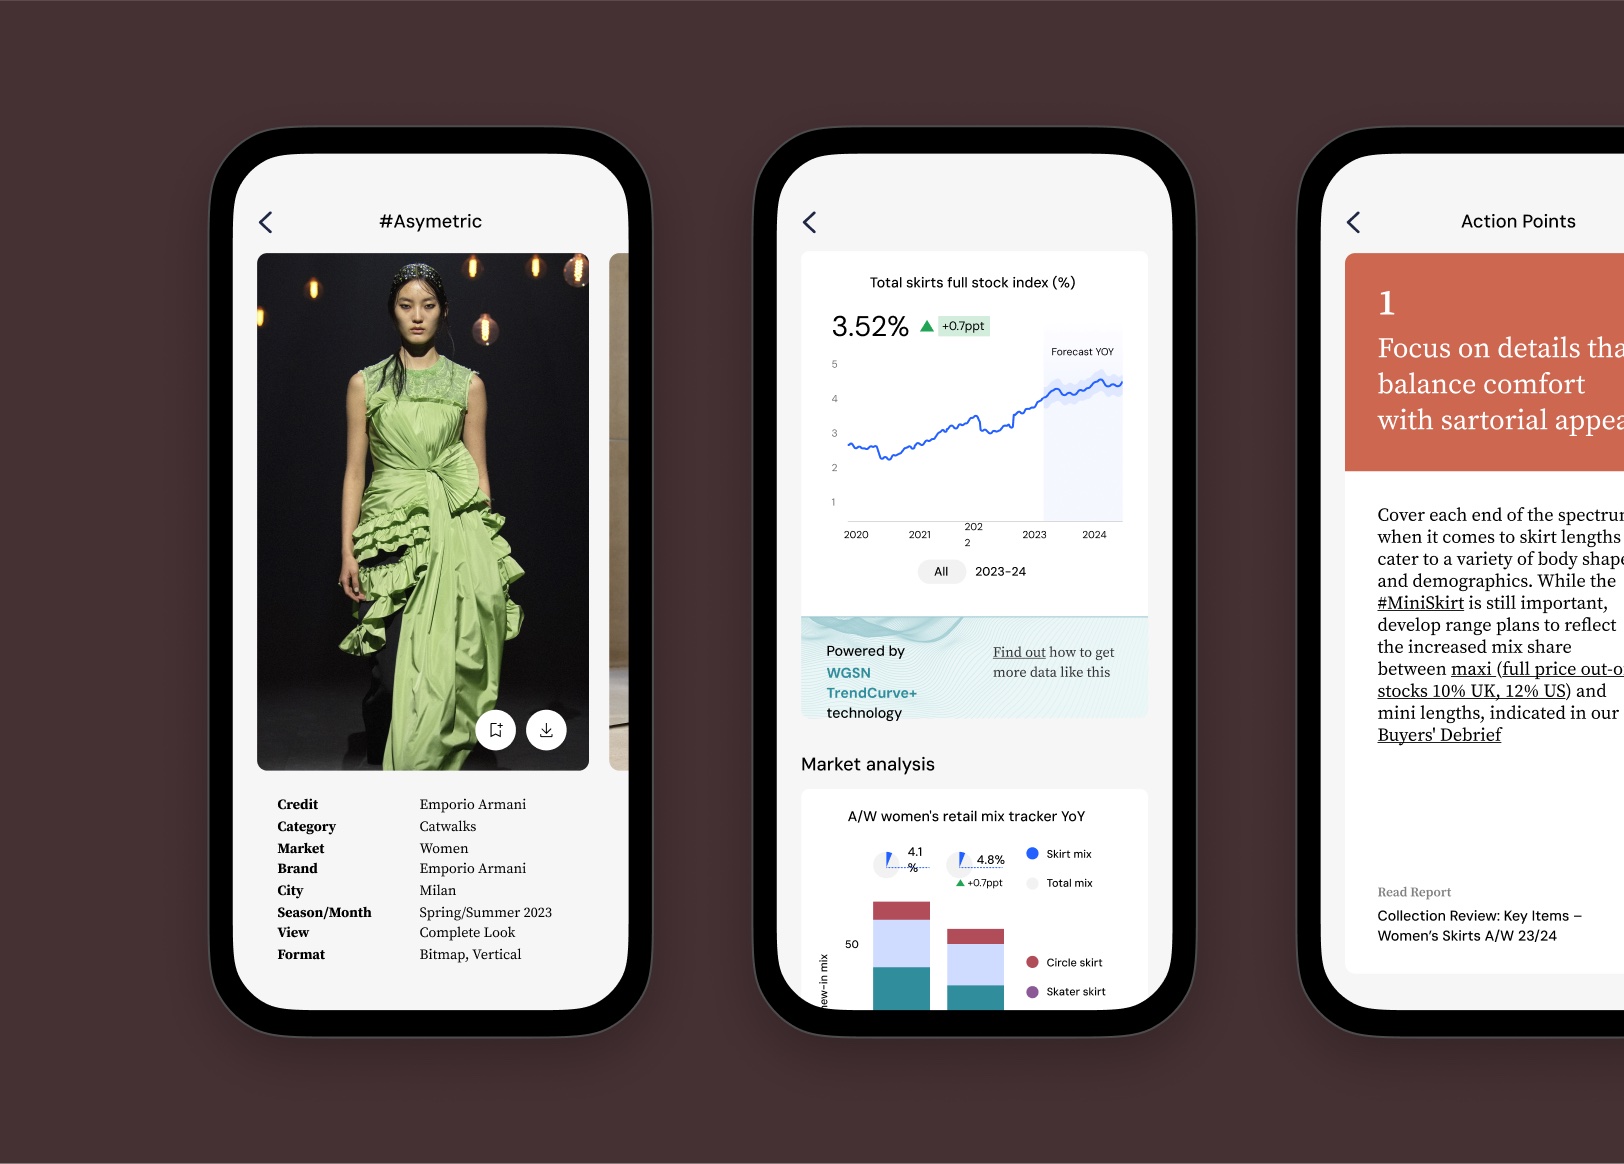
Detailed view on demand. Every card opens into a dedicated view — images, data, or text and action points — without leaving the stream.